Analytic Study of Inductive Earthquake Occurring Due to Tabriz Veniar Dam Reservoir Supplying With Water
Ali javdani1 * and Yousefzadeh Fard2
1
Tabriz University,
Tabriz,
Iran
2
Tabriz Azad University,
Tabriz,
Iran
http://dx.doi.org/10.12944/CWE.10.Special-Issue1.139
Tabriz veniar dam by reservoir volume about 360 milion cubic meters and 50 meter height of river bedis of gravel dam by clay nucleus.this dam is along with north Tabriz fault of active one by historical background of earthquake. Therefore, it requires studying possibility of inductive earthquake occurring on this dam.we have considered noram tensions،،and cross one ØŒ ØŒin limit of 40-45 kilometer from dam by considering reservoir loads in the center of earthquake for1×1 network kilometer and on north fault of tabriz in order to study potential of inductive earthquake on veniar Tabriz dam. in this study,we have used of 19 december 2007 earthquake affairs in which shows stumbling direction in right direction and is concordant with north Tabriz fault. We have used of speedometer apparatus in order to determine earthquake affairs andrecognizing fault face and analyzed result by mathematic models. According to the amount of analysis, we concluded increasing earthquake deep decreases reservoir effects. The most effect of reservoir is on 1-4 kilometers deep and also the amount of fault satability Sr(t) is less than zero on north Tabriz fault in which indicated the influence of veniar dam reservoir on Tabriz fault that push forward earthquake.
Copy the following to cite this article:
Javdani A, Zade M. Y. Analytic Study of Inductive Earthquake Occurring Due to Tabriz Veniar Dam Reservoir Supplying With Water. Special Issue of Curr World Environ 2015;10(Special Issue May 2015). DOI:http://dx.doi.org/10.12944/CWE.10.Special-Issue1.139
Copy the following to cite this URL:
Javdani A, Zade M. Y. Analytic Study of Inductive Earthquake Occurring Due to Tabriz Veniar Dam Reservoir Supplying With Water. Special Issue of Curr World Environ 2015;10(Special Issue May 2015). Available from: http://www.cwejournal.org/?p=11730
Download article (pdf)
Citation Manager
Publish History
Introduction
Making damnad creating reservoir in its backleads to environmental changes in regions around dams.of the most important effects ofdam reservoir in which has been observed in so many eras is beginning of earthquake or change in eras trembling mood and reservoir after supply in h water. This phenomenon has been observed in different eras in the world and has been called induced earthquake or reservoir iduced seismicity and has been considered by engineers and expert in earthquake (Allen, et al,. 1996).
These earthquakes are along with disturbance and nature equilibrium disturb in and there is direct relation among induced earthquake and human activity.therefore, we should expect the center of these false earthquakes be on human activity eras (Assumpcao, et al, 2002).
In general, making dam changes natural tention center as:
- Entering added weight due to loading water height in back of dam
- Increasing penetrating water pressure in fault faces
- Decreasing fault face friction as the role of water softening and lubricating
Occurring induced earthquake in dam reservoir is due to parameters like tension eras condition, stone hydromechanical character uncer reservoir, eras geology and also dimensions and fluctuations of water level in dam reservoir (Berberian, et al,. 1999).
In general, Induced earthquake in water reservoir has occurred on the two types of preliminary and long term in which any one does have its own mechanism. In the first type, increasing the number of earthquake has occurred in before water level and is along with or does lack trembling in deep parts of reservoir. In this case, during time passing the number and greatness of earthquake would decrease. In the long term type, earthquake has occurred on the deep part of reservoir and the eras around it. In this case, with our decrease in the number and its greatness, earthquake continues for the long term. The greateset earthquake occure when water level reaches to the highest one. Time delay among filling reservoir and the beginning of earthquake depends on reservoir characteristic, regional site character and it takes some months to some years long (Chander, R, 1990).
Based on ICOLD suggestion, induced earthquake has been considred on the height more than 100meters or reservoir volume is more than half milliard cubic meters and or small dams on sensitive region (Chander, R, Kalpna, 1997).
When we recognized induced earthquake dependence to the reserved volume of water and its height, in Mead Lake on the beginning of 1940, has occurred more than 100 induced earthquakes in different parts of the world by different greatness. In the last of 60 decade and the beginning of 70, after general agreement of researchers on this problem in which supply in water in great reservoir could leads to induced earthquake by 5-6/5 and destruction power, the induced earthquake has been considered, seriously. Early, it has been cleared eras without trembling activity and eras in which does have low level in earthquake on comparing to active eras does not have lower potential in induced earthquake occurring. For example, in Kremasta dam in Greece by th height of 160 meter and reservoir volume of 4/8 miloliard cubic meters, after supplying water on 1966, ocuured an earthquake by 6/3rishter greatness.Also, in 9 kilometer distance from Koyna dam in india by the height of 103 meters and reservoir volume about 2/7 milliard cubic meters on 1967, have had earhthquake by the same greatness (Chen, L, Talwani, P, 1998) (Chen. L, Talwani, P, 2001).
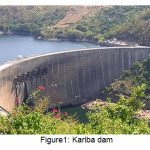
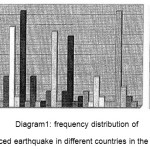
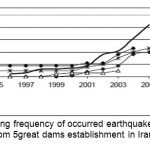
Karibe dam (figure1) in Zambia and Zimbabve border by the height of 128 meters and reservoir volume of 175 millirad cubic meters has been supplied by water from 1956 to 1971, and observed so many earthquakes in which have had coordination to the continuity of supplying water (Feng Deyi, Yu Xuejnu, 1992).The greatest earthquake by 6 rishter greatness occurred when water level reavhes the most level.induced earthquakes are dure to loading reservoir dam in other eras in the world like U.S, France, japan, Italia, Greece, brazillia. (Figure2) diagram 1 and table 1 summarize frequency distribution of these earhthquakes in different parts of the world (Gahalaut, et al,. 2007).
 |
|
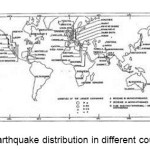 |
Figure 2: induced earthquake distribution in different countries of the world Click here to View figure |
 |
|
Table1: induced earthquake in different eras in the world
|
RIS level |
Magnitude |
Date |
Maximum depth |
Dam type |
country |
Dam name |
|
II |
5.3 |
11.1964 |
109 |
RF |
Ghana |
Akosombo |
|
III |
2 |
1.1972 |
185 |
CA |
Spain |
Almendra |
|
II |
>=3.5 |
Japan |
Arimine |
|||
|
II |
>-=3.5 |
GIFU |
Asahi |
|||
|
II |
5.6 |
14.11.1981 |
111 |
ER,RF |
Egypt |
Aswan |
|
II |
4.8 |
3.7.19.67 |
81 |
HCG |
Yogoslavia |
Bajina Basta |
|
II |
5 |
7.7.1966 |
96 |
EF |
New Zealand |
Benmore |
|
II |
4.8 |
15.9.1983 |
57.5 |
mG |
India |
Bhatsa |
|
II |
3.5 |
6.1.1973 |
95 |
EF |
Australia |
Blowering |
|
III |
2 |
1968 |
46 |
RF |
USA |
Cabin Creek |
|
II |
4.7 |
23.1.1972 |
20.7 |
CG |
Brazil |
Cajuru |
|
II |
4.1 |
15.4.1964 |
43.6 |
CG |
Spain |
Camarillas |
|
II |
4.7 |
9.6.1962 |
132 |
CA |
Spain |
Canells |
|
II |
4 |
15.3.1977 |
130 |
EF |
USSR |
Charvak |
|
II |
4.3 |
2.8.1974 |
54 |
CG |
USA |
Ciark Hill |
|
III |
3 |
10.1965 |
190 |
CA |
Switzerland |
ontra |
|
II |
5.2 |
6.6.1962 |
22 |
E |
USA |
Coyote Vally |
Ranking in the last column of table has been provided for different levels of induced earthquake :
- Level I, induced earthquake by more than 6rishter greatness
- Level II, induced earthquake by 3/1-5/9 rishter greatness
- Level III, induced earthquake by less than 3 greatness.
- A: Arch C:Concrete
- G: Gravity E:Earth
- RF: Rockfill H: Hollow
- M: Masonary D: Double Curvature
- EF: Earth Fill MU: Multiple
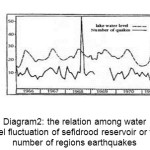
Sefidrood dam is the first dam in Iran in which we have studies the relation among dam lakes forming and increasing the number of regional earthquakes.before creating dam, there was no important earthquake in this eras. Study of trembling registered on the sefidrood recognition trembling establishment shows of the beginning of making dam, there is about 120 light trembling, yearly. The center of these trembling is about 40 kilometers of dam and its greatness is less than 2rishters. The number of these earthquakes is usually about 5-15 monthly and is dependent to the change of water height in dam lakes (Guha,S, K, Patil D, N, 1992).
 |
|
Considering induced earthquake in some geart dams in Iran (karoon3, latian,lar, shirin dare, rajaee)shows increasing earthquakes by passing time after supplying water in dam. Diagram3
 |
|
Study of larkhe dam on 2022 shows the greatnessof registered earethquake is less than 4/3 rishter. Although, these earthquakes greatness is low, but repeated earthquake occurring is influential on occurring gradient instability in the dal reservoir and its arounds (Gupta, H, K, Rastogi, B, K, 1976).
Methodology
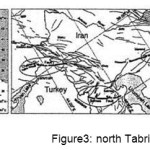
In this studying analysis, possibility of induced earthquake occurring due to supplying water of veniar reservoir dam has been considered. Venire dam does have volume about 360 million cubic meter and the height of 50 meter from bed and 92 meters of foundation of gravel type and clay nucleus by reservoir level of 40/22 square kilometers.this dam is 3 kilometers on north of Tabriz and along with north Tabriz fault. According to nearness of dam to active fault, we have applied tensions and stability in modeling Tabriz fault characteristic (Gupta, H, K, 1985) (Gupta, H, K, 2005).
North Tabriz fault is one of the most active fault in northwest of Iran.the length of fault is about 150kilometer, of the northwestcontinues to the southeast. In direction of fault to the northwest leads to reverted faults of soufian and tasouj. The continue of these faults has changed to the north of Tabriz, whereas has tendency to the west- northwest. On the other hand, contibue of southeast fault of north Tabriz has ended to some reverted faults. (North and south of bezghoush, dozdouzan fault and south of sarab fault) in which their change direction is to north-northeast. In the first published records, this fault has been introduced as reverted fault by high gradient. In this case, by studying air images, there is observance to replace right-direction waterway in the length of north Tabriz fault (Hamzehloo, et al,. 1997) (Hessami, et al,. 2003)
 |
|
In order to study and answer to the question, does veniar reservoir dam have the potential of creating induced earthquake? We have evaluated normal tensions ØŒ(t)z σ, (t)y σ, (t)xσ and cross (t)xyτØŒ (t)zxτØŒ(t)yz τ in 40 kilomteres to dam by reservoir loads in the center of earthquake on 1×1kilometers network and on north Tabriz fault. Fault face has been evaluated for calculating tensions on the center of earthquake in future by direction, gradient and rike, 310, 85, 170 by standard deviation of 0.25, respectively. They have been evaluated by speedometer data in Tabriz network. Then fault stability Sr(t) has been calculated due to tensions of reservoir loads and controlled reservoir dam (Lixin Yi, et al,. 2012).
In order to forecast induced earthquake of reservoir, we should consider preindicators like water level changes and trembling, vp/vs changes and b parameter change (Hafezi Moghaddas, et al,. 2005).
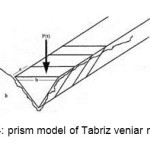
In order to modeling fault influence on the possibility of induced earthquake occurring, recent earthquake affairs have been analyzed on this fault and we concluded fault characteristic. Then reservoir dam has been divided to 76 tearing prism. Point loads modeled of these prismas has passed from the center of aby prism. (figure 4, 5)
 |
|
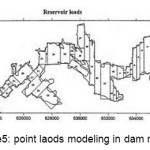 |
Figure 5: point laods modeling in dam reservoir Click here to View figure |
The most deep of reservoir near dam is 50 meters in which is equal to dam height from bed. Water deep in other prism is based on reservoir topograpgy map.
Table2: shows these prism characteristic and the amount of volume and point loads coordinates.
|
Xc |
Yc |
L(m) |
D(m) |
depth |
|
|
1 |
621274.0816 |
4219804.579 |
426.13 |
288 |
50 |
|
2 |
621890.0147 |
4219683.014 |
736.13 |
350.33 |
45 |
|
3 |
622408.6932 |
4219626.283 |
741.76 |
220.02 |
40 |
|
4 |
622408.6932 |
4219018.456 |
528 |
174.58 |
35 |
|
5 |
622846.3283 |
4218799.638 |
654.5 |
293.52 |
35 |
|
6 |
623356.9033 |
4218856.369 |
386.7 |
189.54 |
27 |
|
7 |
623859.3726 |
4218491.674 |
652.7 |
185.61 |
17 |
|
8 |
624248.3825 |
4218321.481 |
156.23 |
108 |
8 |
|
9 |
623640.5551 |
4218864.475 |
226.5 |
178.9 |
17 |
|
10 |
623121.8766 |
4219083.292 |
850.38 |
295.59 |
29 |
|
11 |
622676.1359 |
4219294.004 |
189.81 |
116.72 |
29 |
|
12 |
623413.634 |
4219358.84 |
251.84 |
233.5 |
24 |
|
13 |
622740.9723 |
4219585.761 |
251.84 |
233.5 |
29 |
|
14 |
623032.7276 |
4219780.266 |
252 |
189.84 |
29 |
|
15 |
623275.8599 |
4219601.971 |
300.35 |
170.25 |
28 |
|
16 |
623348.7976 |
4219934.25 |
423.26 |
189.93 |
28 |
|
17 |
623802.6418 |
4219934.25 |
776.84 |
268.58 |
27 |
|
18 |
623940.416 |
4219804.579 |
661.2 |
99034 |
27 |
|
19 |
624037.6685 |
4219747.848 |
543.53 |
88.39 |
27 |
|
20 |
624248.3825 |
4219545.24 |
471.85 |
354.25 |
27 |
|
21 |
624872.417 |
4219545.24 |
792.17 |
330.31 |
27 |
|
22 |
624586.0176 |
4219828.892 |
614.49 |
353.69 |
27 |
|
23 |
625010.1912 |
4220144.962 |
550.05 |
283.73 |
27 |
|
24 |
625358.6894 |
4220290.841 |
825.85 |
425.86 |
26 |
|
25 |
625342.4703 |
4221158.006 |
664.5 |
270.06 |
25 |
|
26 |
626007.0285 |
4220850.042 |
1251.69 |
781.88 |
24 |
|
27 |
626614.8539 |
4220639.328 |
658.32 |
407.91 |
23 |
|
28 |
626639.1665 |
4219982.875 |
1595.17 |
554.73 |
17 |
|
29 |
627230.7848 |
4219845.101 |
1365.56 |
501.21 |
13 |
|
30 |
627822.4032 |
4219164.336 |
1290.52 |
903.5 |
9 |
|
31 |
627117.3254 |
4221020.232 |
578.68 |
611.69 |
24 |
|
32 |
627344.2464 |
4221944.129 |
934.5 |
463.52 |
23 |
|
33 |
627636.0039 |
4222008.964 |
1208 |
127.75 |
21 |
|
34 |
628138.4732 |
4222154.843 |
1475 |
894.25 |
21 |
|
35 |
628900.284 |
4222187.259 |
1398 |
675.18 |
21 |
|
36 |
629451.3806 |
4222479.017 |
686 |
346.75 |
21 |
|
37 |
630042.9969 |
4223346.184 |
1569.54 |
507.39 |
13 |
|
38 |
629970.0591 |
4222162.947 |
883.5 |
682.51 |
18 |
|
39 |
629978.1626 |
4221198.528 |
1493.18 |
472.02 |
9 |
|
40 |
630480.6341 |
4222560.06 |
1839.5 |
372.33 |
13 |
|
41 |
630869.6419 |
4221441.66 |
3037 |
357.68 |
17 |
|
42 |
631242.4427 |
4220517.762 |
2277.51 |
416.19 |
16 |
|
43 |
631834.0611 |
4220258.423 |
2394.01 |
657 |
16 |
|
44 |
632255.2438 |
4219685.186 |
1438.07 |
241.05 |
15 |
|
45 |
632463.4829 |
4219417.451 |
912.5 |
197.18 |
14 |
|
46 |
632649.4107 |
4219283.583 |
708 |
168.04 |
8 |
|
47 |
632902.2701 |
4219216.65 |
365.07 |
313.94 |
6 |
|
48 |
632389.1113 |
4220949.49 |
890.53 |
51803 |
18 |
|
49 |
632865.0854 |
4220919.741 |
832 |
452.85 |
16 |
|
50 |
633177.443 |
4220823.06 |
482.05 |
160.56 |
16 |
|
51 |
63343045 |
4220949.49 |
722.5 |
321.18 |
16 |
|
52 |
633668.2905 |
4221127.98 |
774 |
160.56 |
16 |
|
53 |
633876.5296 |
4221484.96 |
22.63 |
277.52 |
16 |
|
54 |
634129.389 |
4221574.205 |
2343.5 |
233.68 |
16 |
|
55 |
634397.124 |
4221812.191 |
2226.5 |
299.4 |
15 |
|
56 |
634776.4153 |
4222079.926 |
2503.5 |
467.18 |
15 |
|
57 |
635170.5822 |
4221879.24 |
3117 |
328.58 |
14 |
|
58 |
635460.6285 |
4222035.303 |
3109.5 |
306.64 |
14 |
|
59 |
635869.6667 |
4222042.741 |
3277.53 |
408.88 |
13 |
|
60 |
636338.205 |
4222206.357 |
2810.5 |
547.48 |
12 |
|
61 |
636791.8658 |
4222027.867 |
2657 |
358.04 |
11 |
|
62 |
637081.9121 |
4222057.614 |
2394 |
240.87 |
11 |
|
63 |
637327.3359 |
4221953.496 |
1927.01 |
211.82 |
10 |
|
64 |
637572.7596 |
4222801.324 |
2241 |
299.31 |
8 |
|
65 |
637959.4866 |
4222831.073 |
2095.01 |
474.49 |
7 |
|
66 |
638100.7919 |
4224221.806 |
504.05 |
554.75 |
7 |
|
67 |
638442.8985 |
4222823.635 |
1810.5 |
481.81 |
7 |
|
68 |
638747.8182 |
4223240.111 |
980.5 |
138.89 |
5 |
|
69 |
639075.0492 |
4223069.059 |
1146 |
526.08 |
5 |
|
70 |
639476.6517 |
4223426.039 |
1730 |
255.5 |
5 |
|
71 |
639796.4471 |
4223589.653 |
686 |
379.69 |
4 |
|
72 |
640153.4271 |
4223760.707 |
409.06 |
350.37 |
4 |
|
73 |
640443.4734 |
4223537.595 |
657 |
233.68 |
4 |
|
74 |
640659.1481 |
4223470.661 |
460.23 |
204.95 |
4 |
|
75 |
640874.825 |
4223611.964 |
562.19 |
233.56 |
4 |
|
76 |
624323.5969 |
4218190.332 |
131.98 |
47.02 |
2 |
Achieved affairs through east and west of north Tabriz fault shows direction mechanism of trembling (Jackson, J, 1992) (Stabile, 2014).
Earthquake affairs have been determined based on the first move in different stations registering earthquake.
By developing speedometers in around eras, there is possibility to determine earthquake affairs to these datas.(speedometer are data in which register time history of speed)in these methos, fault parameter along with speed, dimension, break speed and beginning point of break, has been considred as entry model.
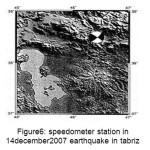
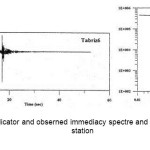
14 december 2007 Tabriz earthquake affairs:
2007 earthquake in Tabriz has been registered in6 stations. (figure5) speed spectrre has been shown for basmanj, khaje, tabriz4, 6 by SH indicator in figures6-12. By solving fault face for this earthquake by the aid of stations spectre, direction, gradient and rike has been evaluated 310, 85,170degree by 25% standard deviation, respectively. Achieved affairs shows right dirtection of trembling in which is coordinated to north Tabriz fault, achieved parameters of this analysis has been used for evaluating stress due to reservoir loads on north Tabriz fault.
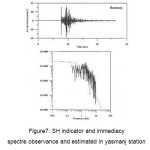
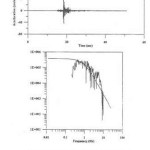
2007 earthquake in Tabriz has been registered in 4 ststions in Tabriz(figure6)immediacy spectre of speed has been shown for basmanj, lighvan, tabriz4, 6, stations by SH indicators in figures7-11
 |
|
 |
|
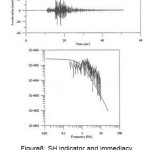 |
Figure 8: SH indicator and immediacy spectre and estimated in lighvan station Click here to View figure |
 |
|
 |
|
Study of datas from registered trembling in these stations around north Tabriz fault and mathematics modeling, tensions evaluation and fault stability and also cotensions lines has been achieved for the deeps of 1,2,3,4,5,10, 15, 20 kilometers.
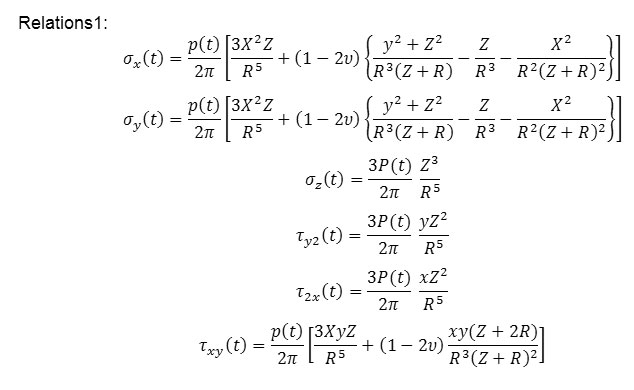
By the aid of relation1: affairs related to Tabriz 14 december 2007 earthquake,normal tensionsØŒ(t)y σØŒ(t)z,σ(t)xσ and cross(t)xyτØŒ (t)zxτØŒ(t)yz τ in 40 kilomteres of dam and reservoir loads in the center od earthquake has been evaluated for network 1 in 1 kilometer. In these relationa, cooredinated axis of ox is in north direction, oy axis in east direction, oz axis is vertical to the two axes and inner sides of earth, and v is coeffiecent of poasun. Supoosed earthquake center is considered on 1, 2,3,4,5,10,15,20 kilometers.
In order to calculate fault stability, we suppose tensions are due to different coactions leads to center of earthquake in future. These tensions are related to topography changes on techtonical coactions or ambient stress. In addition, water penetration could active regional faults. Inaddition to above tensions, dam reservoir creates tensions on the center of earthquake in future and put forward earthquake occurring. Stability on fault face when there is no reservoir dam includes:
Relation 2
Sa(t) = σa(t)tanφ - ta(t)
Tensions of σa(t), ta(t)
are sum of normal and cross in the center of earthquake on fault face in which changes by time passing. Therefore, anatural earthquake occurs when Sa(t) is equall to zero.when we have reservoir dam, fault stability due to reservoir has been described by :
Relation 3
Sr(t) = σr(t)tanφ - tr(t)
Tensions of σr(t), tr(t)
are normal and cross one. General stability of fault due to techtonical and reservoir coactionsis:
Relation 4
S(t) = Sa(t) - Sr(t)
If Sr(t) is more than zero,the influence of reservoir on faultdelays occurring earthquake
If Sr(t) is less than zero, the influence of reservoir on fault delays occurring earthquake.
If Sr(t) is equal to zero, the influence of reservoir on fault is neutral.
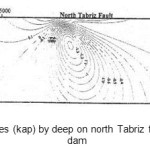
According to relation 3,stability lines on network 40 in 40 kilometers has been accounted.we have considred normal tension and cross Ùˆ acting tensions on fault face.we have considred the two tensions’sum of cross tensions.related stability lines has been shown on 11-14figures.
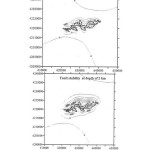 |
Figure 11: stability lines based on paskal on 1-2kilometers deep Click here to View figure |
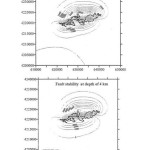 |
Figure 12: stability lines based on paskal in 3-4kilometers deep Click here to View figure |
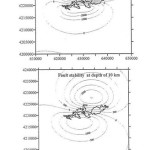 |
Figure 13: stability lines based on paskal in 5-10 kilometers deep. Click here to View figure |
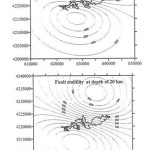 |
Figure 14: stabilioty lines based on paskal in 15-20 kilometers deep Click here to View figure |
Results
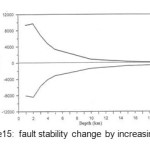
Figure15 shows fault stability changes by increasing earth deep. Whereas, by increasing earthquakes deep, the influence of reservoir decreases and reservoir would be neutral. The most influence of reservoir in the deep of 1-4kilometers is observed in which is coordinated to the deep of induced earthquake.
 |
|
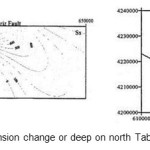
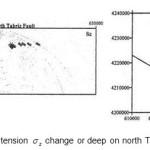
Figures page 16-21 shows normal tensions σx(t), σy(t), σz(t) and cross one txy(t),tzx(t), tyz(t) on north Tabriz fault to 20kilometers deep due to veniar dam reservoir loads.
 |
|
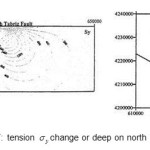 |
Figure 17: tension σy change or deep on north Tabriz fault Click here to View figure |
 |
|
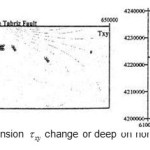 |
Figure 19: tension txy change or deep on north Tabriz fault Click here to View figure |
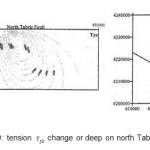 |
Figure 20: tension tyz change or deep on north Tabriz fault Click here to View figure |
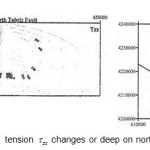 |
Figure 21: tension tzx changes or deep on north Tabriz fault. Click here to View figure |
 |
|
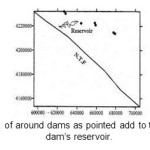
North Tabriz fault stability due to veniar reservoir dam and around reservoir dam loads
Figure23 shows loeads of around dams as pointed add to the whole loads of around dam’s reservoir. Figure24 shows the negiligible influence of these reservoirs.
 |
|
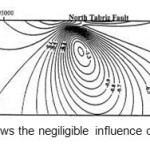 |
Figure 24: shows the negiligible influence of these reservoirs. Click here to View figure |
Discussion
The result shows created tensions due to different coactions leads creating earthquake center. These tensions are related to changes in topography and techtonical coactions. in addition to above tensions, dam reservoir is creating tensions on the center of earthquake and put forward occurance of earthquake.
Analyzing result shows
- According to the amount less than zero stability for sr (t), therefore, veniar dam reservoir influence on Tabriz fault put forward earthquake.
- The amountfor veniar dam(-1/3 kpa) compared to estimated amount fot Loyna dam in india(30kpa)and india rihand dam reservoir(90kpa)is very negiligible in which has been approved occurring induced earthquake there. Veniar reservoir dam is fitted fior induced earthquake but put forward earthquake on north Tabriz fault.
- Fault stability changes by increasing deep shows by increasing deep of earthquake, the influence of reservoir decreases and reservoir would be neutral.
- The most influence of reservoir is in the deep of 1-4kilometers in which is cooridinated to induced earthquake deep. Because we have observed induced earthquake after supplying water in dam or some time after that (some weeks after supplying water), therefore, according to this conditions, we should supply water in dam, gradually.
Suggestions
- Veniar dam is 5 kilomters to Tabriz cityand on the north fault of Tabriz, desigining and assembling regional network of registering earthquake for registering behavior before and after supplying water is required.
Regional network assembling includes 6 apparatus for registering earthquake by feasible band for registering regional earthquake in which could have induced origin, before and at the same time of supplying water….could determine the exact place of techtonic earthquake in dam arounds and also induced earhthquake along with dam supplying water ocuured and report to audit establishment by descriptive lists. On the other hand, this network as speedy alert system could be used for Tabriz city by high background in earhthquake.
Refrences
- Allen, T, Gibson, G, Hill, C 1996, The Thomson Reservoir – Triggered Earthquakes, Monash University, Seismology Research Centre and Melbourne Water Corporation, Australia.
- Assumpcao, M, Marza, V, Barros, L, Chimpliganond, C, Soares, J, E, Carvalho, J, Caixeta, D, Amorim, A, Cabral, E, 2002, Reservoir – induced seismicity in Brazil, Pure and Applied Geophysics. 159, 597 – 617
- Berberian, M, Yeats, R, S, 1999, Patterns of historical Earthquakes rupture in the Iranian plateau Bull. Seismo. Soc, Am, 89, 120-139.
- Chander, R, 1990, Reservoir induced destabilization of Reservoir and thrust faults, Bulletin of the Indian society of Earthquakes technology Special issue on Reservoir induced seismicity, pp, 35-46, vol, 27, no.4, December 1990.
- Chander, R, Kalpna, 1997, on categorizing induced and natural tectonic Earthquakes near new Reservoir, Engineering Geology, 46, 81-92.
- Chen, L, Talwani, P, 1998, Reservoir – induced seismicity IN CHINA Pure and Applied Geophysics. 153, 133-149
- L, Talwani, P, 2001. Renewed seismicity near Monticello Reservoir, South Carolina, 1996-1999. Bulletin of the Seismological society of emerica, 91, 94-101.
- Feng Deyi, Yu Xuejnu, 1992. vp/vs Variation before Reservoir – induced seismic events, induced seismicity, edited by: peter knoll, cetral institute for physics of the earth, Potsdom, printed in Netherlands. pp. 237-242.
- Gahalaut, K, Gahalaut, V, K, Penday, M. R, 2007. A new case of Reservoir triggered seismicity, Govind Ballav pant Reservoir (Rihand dam) central india tectonophysics 439, 171-178
- Guha,S, K, Patil D, N, 1992, large water Reservoir related induced seismicity, induced seismicity, Balkema, 243-266.
- Gupta, H, K, Rastogi, B, K, 1976. Dams and Earthquakes, Elsevier Publ,Amesterdam.
- Gupta, H, K, 1985, the present status of Reservoir – induced seismicity investigations with special emphasis on koyna Earthquakes, tectonophysics, 118, 257-279
- Gupta, H, K, 2005. Artificial water Reservoir – triggered Earthquakes with special emphasis at koyna, current science, 88, 1628 – 1631.
- Hamzehloo, H, R, Chander R and I. sarkar 1997. Role of sefidrud Reservoir in the occurrence of the rudbar Earthquakes of 1990, Bull, ind, soc, earth. Tech, paper no. 363 vol 34, pp, 17-25
- Hessami, K, Pantosti, D, Tabassi, H, Shabanian, E, Abbassi, M.R, Feghhi, K, Solaymani, S. 2003. Paleoearthquakes and slip rates of the North Tabriz Fault, NW iran: Preliminary resylts ANNALA of GEOGHYSICS, 46, 903-915.
- Lixin Yi, Dong, Zhao, and Chenglong, Liu, September/October 2012. Preliminary Study of Reservoirâ€Induced Seismicity in the Three Gorges Reservoir. China Seismological Research. Letters,, v. 83, p. 806-814,
- Hafezi Moghaddas,N, Asghari, Gasem Nov. 2005.Induced Earthquakes Related To Some Of Important Dams In Iran. IX Iranian Geology Conference, University Of Tehran,.
- Jackson, J, 1992, Partitioning of strike – slip and convergent motion between Eurasia and Arabia in eastern turkey and the Caucasus, J, Geophys, Res. 97, 12471-12479
- Stabile, Tony Alfredo, Giocoli, Alessandro, Lapenna, Vincenzo and etc. First published on June 10, 2014 Evidence of Lowâ€Magnitude Continued Reservoirâ€Induced Seismicity Associated with the Pertusillo Artificial Lake (Southern Italy). Bulletin of the Seismological Society of America, August 2014, v. 104, p. 1820-1828,


